 HomeCountiesArticlesMethodologyContact
Why the Economy Can Grow — and Even Add Jobs — While Your County Falls Apart
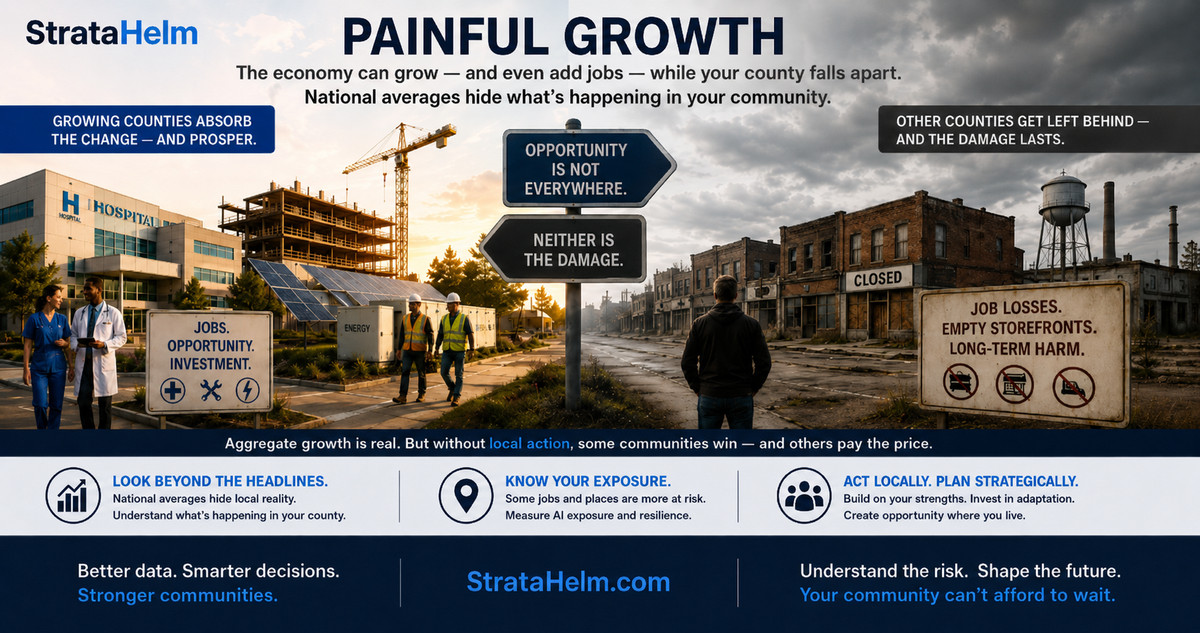
The most dangerous sentence a municipal leader will hear over the next five years is "the economy is fine." It may well be true at the national level and catastrophically false at the county level at the same time. The likeliest path for the AI transition is not collapse and not painless abundance, but growth that is real in the aggregate and brutally uneven underneath: rising GDP, possibly even rising total employment for a while, distributed so unequally across places and professions that large numbers of communities and workers experience a boom as a bust. This is not a paradox. It is the documented pattern of every major labor-market disruption of the past half-century — automation, globalization, the China Shock — and there is no strong reason to expect AI to break the mold. This briefing explains the mechanics of painful growth, why national averages will mislead you, and what a leader can measure and do when the headline numbers and the reality on your Main Street disagree.
Begin with the honest good news, because credibility requires it. AI is fundamentally a productivity shock, and productivity shocks tend to grow economies. The Bureau of Labor Statistics projects the U.S. economy to add 5.2 million jobs from 2024 to 2034, with total employment rising to 175.2 million (BLS, 2025). History rhymes: more than 60 percent of the jobs Americans worked in 2018 were in occupations that did not exist in 1940, as technology created entirely new categories of work even while destroying old ones (Autor et al.; Barclays, 2026). Over the near term, many AI-exposed occupations may hold steady or grow as the technology augments rather than replaces — and AI-adjacent roles (data, integration, oversight, and the enormous physical build-out of data centers and power infrastructure) are expanding fast. A leader who predicts imminent economy-wide collapse will most likely be wrong, and will lose the credibility needed for the harder message.
Now the hard part. Aggregate growth is an average, and averages hide the two distributions that actually determine whether a given community thrives: which professions grow, and which places grow. On both, the evidence points to divergence, not convergence.
The same BLS projection that adds 5.2 million jobs also projects office and administrative support to decline as AI automates routine work, sales occupations to fall to e-commerce and automation, and production occupations to shrink further — while healthcare, computer and mathematical occupations, and skilled trades surge (BLS, 2025). This is employment polarization, the best-documented labor pattern of the modern era: technology hollows out middle-skill routine work while growth concentrates at the high-skill and hands-on-service ends (Autor & Dorn, 2013). The net number is positive; the composition is a great reshuffling. A worker in a growing occupation experiences abundance. A worker in a shrinking one, holding identical aggregate statistics in their hand, experiences the 1980s. The economy does not add and subtract jobs from the same people.
Geography is where painful growth does its worst work, for one stubborn reason established in the China Shock literature: workers do not move the way textbook economics assumes. When Chinese import competition hit specific U.S. local labor markets, the damage — depressed wages, elevated unemployment, reduced labor-force participation — persisted for at least a decade, because displaced workers largely stayed put rather than relocating to opportunity (Autor, Dorn & Hanson, 2013). Skilled trades are even less mobile than most: as one recruitment executive noted of the AI build-out, unlike software developers who can work remotely, skilled tradespeople have very low geographic mobility (Randstad, via CNBC, 2026). The consequence is that the new jobs and the displaced workers can end up in different zip codes — and the gap does not close on its own. National recovery statistics are assembled by adding a booming county to a collapsing one and reporting the meaningless midpoint.
National averages are built by putting one foot in a bucket of ice and the other in a bucket of fire, and reporting a comfortable temperature.
Combine the professional and geographic distributions and communities sort, roughly, into two fates.
Even in the "winning" counties, wages tell only half the story. If an influx of workers into growing sectors pushes wages down or holds them flat, whether those workers can build meaningful lives depends on what their money buys — the local cost of living. Here the news is mixed in a specific and important way. AI may well deflate the price of many cognitive services (software, analysis, some professional advice), which raises real incomes. But the two largest line items in a household budget — housing and healthcare — are exactly the sectors most resistant to deflation. Worse, housing costs rise most in the very places drawing in-migration: research on local labor markets finds that much of the wage gain from moving to a high-opportunity city is eaten by higher rents, because housing supply is constrained (Moretti and related agglomeration literature). So the optimistic scenario — stagnant nominal wages rescued by falling prices — runs directly into a housing-cost wall in the growing regions, and the pessimistic scenario — stagnant wages and rising housing costs — is a live possibility in any supply-constrained boom county. For municipal leaders, this elevates housing supply from a quality-of-life issue to the central determinant of whether local growth is livable.
There is a final loop that makes painful growth uniquely dangerous for local governments. The sector most reliably absorbing displaced workers — healthcare — is heavily funded by government (Medicare, Medicaid, public reimbursement). Its ability to keep hiring and paying depends on public budgets. But those budgets draw on the very tax base that AI-driven displacement erodes: income and property taxes from the white-collar workers and commercial real estate under pressure. A county can therefore find its safety-valve sector fiscally squeezed at exactly the moment it is most needed — the absorbing sector and the eroding tax base drawing from the same well. This is the kind of second-order dynamic that never appears in a national GDP release but decides whether a city balances its budget.
If national and even state numbers will mislead, leaders need local instruments:
The AI transition will most likely produce growth — and that is precisely why it is dangerous for local leaders, because growth is the cover under which severe, concentrated harm travels unremarked. The national economy can expand while your county contracts; total employment can rise while your Main Street empties; a boom county can grow while its own workers are priced out. None of this is a forecast of doom. It is a warning against the specific, comfortable error of reading a national average and concluding that your community is safe. The leaders who will navigate the next decade are the ones who learn to distrust the average and measure their own ground.
This article describes two kinds of county. Knowing which one you’re in shouldn’t require a procurement process — StrataHelm’s county exposure scorecards are free to look up. See what your revenue base is exposed to →
Autor, D., & Dorn, D. (2013). "The Growth of Low-Skill Service Jobs and the Polarization of the US Labor Market." American Economic Review, 103(5), 1553–1597.
Autor, D., Dorn, D., & Hanson, G. (2013). "The China Syndrome: Local Labor Market Effects of Import Competition in the United States." American Economic Review, 103(6), 2121–2168.
Barclays Investment Bank (2026). "Robots Roll Out, Economies Rewire." Equity Gilt Study, 71st ed.
CNBC (2026). "How the Red-Hot AI Data Center Boom Is Igniting Demand for Trade Workers," citing Randstad. cnbc.com.
Moretti, E. (2012). The New Geography of Jobs. Houghton Mifflin Harcourt (and related agglomeration and local-cost-of-living research).
U.S. Bureau of Labor Statistics (2025). "Employment Projections — 2024–34." Economic News Release and Monthly Labor Review overview. bls.gov.